
In order to better understand the financial results of the municipality of North Hatley, I have analyzed and simplified the results to the best of my knowledge to make them understandable to everyone. Here is a brief financial analysis of the results from recent years, based on the municipality’s financial reports available on the ministry’s website and financial information available on the municipality’s website. All of this was done manually and not with ChatGPT. Only the definitions were created using ChatGPT.
DON’T MISS: The municipality will present its financial results on September 16 at 7:00 p.m. at Saint-Élizabeth Church.
Writing this article has allowed me to paint a picture of the municipality’s financial evolution and highlight some relevant facts. It should be noted that I am neither an accountant nor a tax specialist, so there may be some typos. Please let me know if you spot any so that I can correct them if necessary. The purpose of this article is to provide a partial understanding of North Hatley’s public finances in a few minutes.
Financial reports used to produce this analysis
You can download the official financial reports available on the Department’s website. However, the 2024 reports are not yet available. Financial information for 2024 and 2025 is available in the form of budgets on the municipality’s website only. Here is the list of available reports.
- 2016
- 2017
- 2018
- 2019
- 2020
- 2021
- 2022
- 2023
- Budgets 2024 – revenues
- Budgets 2024 – expenses
- Budgets 2025 – revenues
- Budgets 2025 – expenses (undetailed)
Official financial reports for 2024 not found
The official financial reports for 2024 are not available from the Quebec Ministry of . However, there is a document showing actual expenditures for 2024 and, according to my reading, a document showing actual revenues for 2024 on the municipality’s website.
Glossary to help you (reference Chatgpt)
1. Long-term debt
Borrowings contracted for more than one year (bonds, bank loans, etc.).
This is a component of municipal debt.
2. Net debt
Long-term debt minus subsidies, shares paid by other municipalities/organizations, and amounts already set aside. This is the actual share assumed by the municipality and therefore by its taxpayers.
3. Municipal debt (broader term)
In Quebec, when we talk about municipal debt, it generally means:
- The total debt of a municipality, including:
- long-term debt,
- short-term debt (e.g., line of credit, temporary loans pending a grant),
- sometimes also certain financial commitments (leasing, long-term contracts, guarantees given).
So municipal debt = total debt of the municipality.
Long-term debt = part of this debt.
Net debt = an adjusted measure that represents the actual burden on citizens.
Highlights
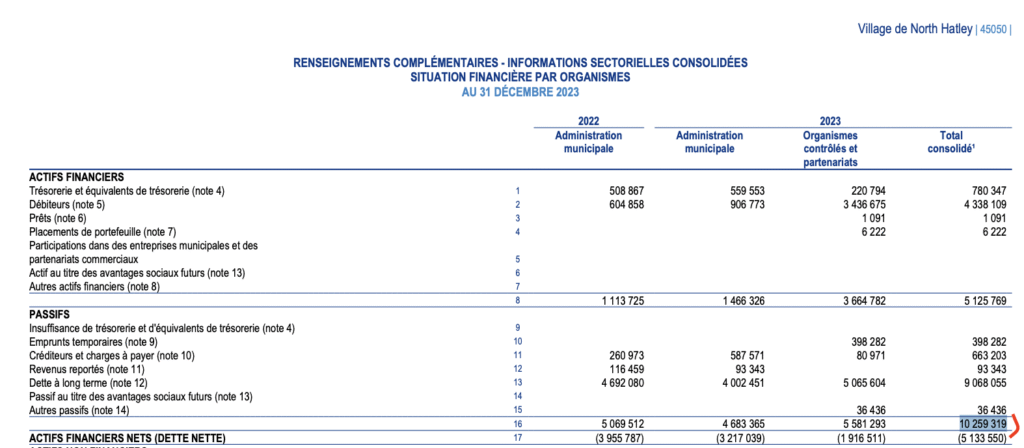
- The municipality’s net debt is $5,133,550 at the end of 2023.
- Long-term debt is $9,068,055 at the end of 2023.
- The municipality’s total liabilities at the end of 2023 amount to $10,259,319.
- The municipality’s total financial assets in 2023 amount to $5,125,769.
- Municipal debt is $4,043,170 at the end of 2023.
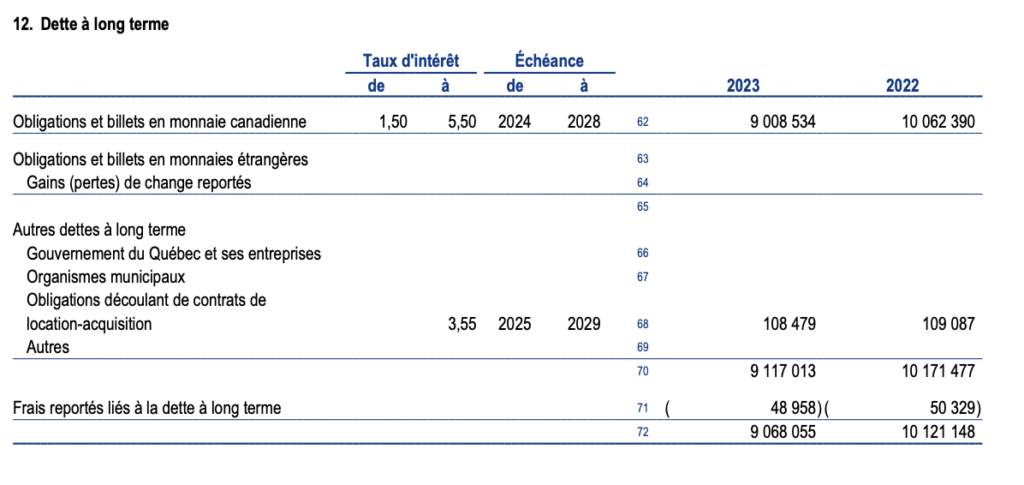
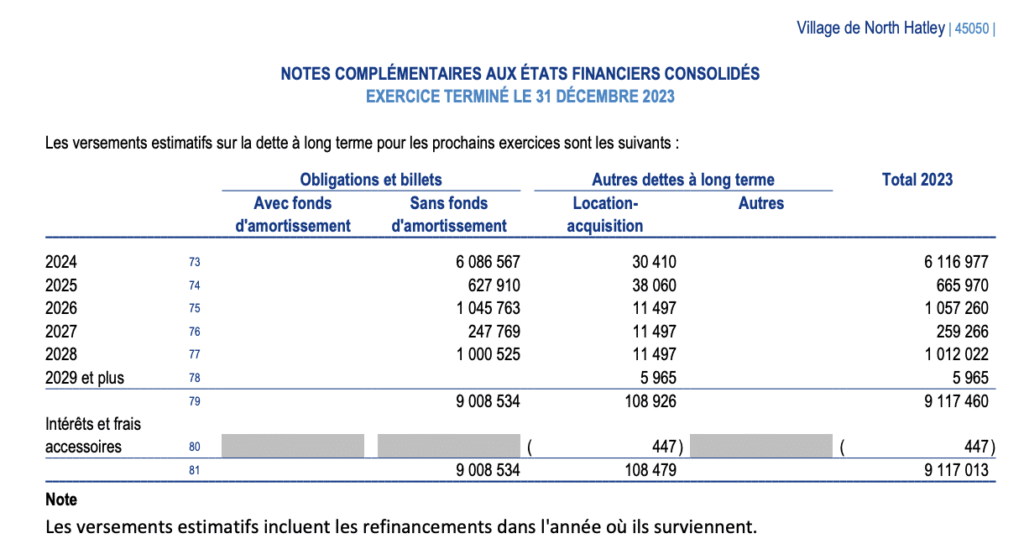
- Long-term debt is repayable at rates ranging from 1.5% to 5.5%. All loans are renewable between 2024 and 2028.
- Administrative costs rose from $481,906 in 2016 to $870,423 in 2025 (budget).
- Administrative costs rose from 15.28% in 2016 to 26.12% in 2025 (budget).
- Administrative costs rose from $15.28 per $100 of expenditure to $26.12 per $100 of expenditure.
- Since 2016, the number of full-time employees has increased from 7 to 11.3.
- The number of employees remains unknown or unavailable for 2024 and 2025.
- The municipality’s payroll has increased from $356,521 in 2016 to $837,966 before social security contributions in 2023.
- It should be noted that actual payroll expenses for 2024 and 2025 cannot be found.
- In 2023, employee compensation and social security contributions totaled $1,004,331, including social security contributions, out of a total expenditure budget of $3,543,932.
- In 2023, municipal employee compensation represented 28.8% of total administrative costs.
Municipal financial assets, liabilities, and net debt in 2023
Municipal revenues since 2016
- The municipality generates most of its revenue from property taxes.
- The main growth in revenues forecast in the 2025 budget is in “Other revenues,” representing a total amount of $198,118, and “Services,” for a total amount of $62,035.
Graph: Change in municipal revenue in dollars since 2016

| Fiscal year | Income |
| 2015 | 3 562 365 $ |
| 2016 | 3 152 849 $ |
| 2017 | 3 378 415 $ |
| 2018 | 3 416 537 $ |
| 2019 | 3 592 789 $ |
| 2020 | 3 592 789 $ |
| 2021 | 4 079 322 $ |
| 2022 | 3 893 674 $ |
| 2023 | 4 488 929 $ |
| 2024 | 3 908 430 $ |
| 2025 (budget) | 4 318 607 $ |
Administrative costs since 2016
- Administrative expenses rose from $481,906 in 2016 to $870,423 in 2025 (budget).
- Administrative fees increased from $15.28 per $100 spent to $26.12 per $100 spent.
Graph showing total administrative costs per year in dollars since 2016

Chart showing administrative fees per $100 spent in dollars since 2016

| Fiscal year | Administrative fees | Total expenses | % Expenses budget | Administrative fees per tranche of 100$ |
| 2016 | 481 906 $ | 3 152 849 $ | 15,28% | 15,28$ |
| 2017 | 518 626 $ | 3 131 984 $ | 16,56% | 16,56$ |
| 2018 | 498 726 $ | 3 185 445 $ | 15,66% | 15,66$ |
| 2019 | 524 806 $ | 3 421 107 $ | 15,34% | 15,34$ |
| 2020 | 548 534 $ | 2 827 495 $ | 19,40% | 19,40$ |
| 2021 | 612 813 $ | 2 946 216 $ | 20,80% | 20,80$ |
| 2022 | 640 111 $ | 3 092 324 $ | 20,70% | 20,70$ |
| 2023 | 786 750 $ | 3 543 932 $ | 22,20% | 22,20$ |
| 2024 | 803 485 $ | 3 908 430 $ | 20,56% | 20,56$ |
| 2025 (budget) | 870 423 $ | 3 332 433 $ | 26,12% | 26,12$ |
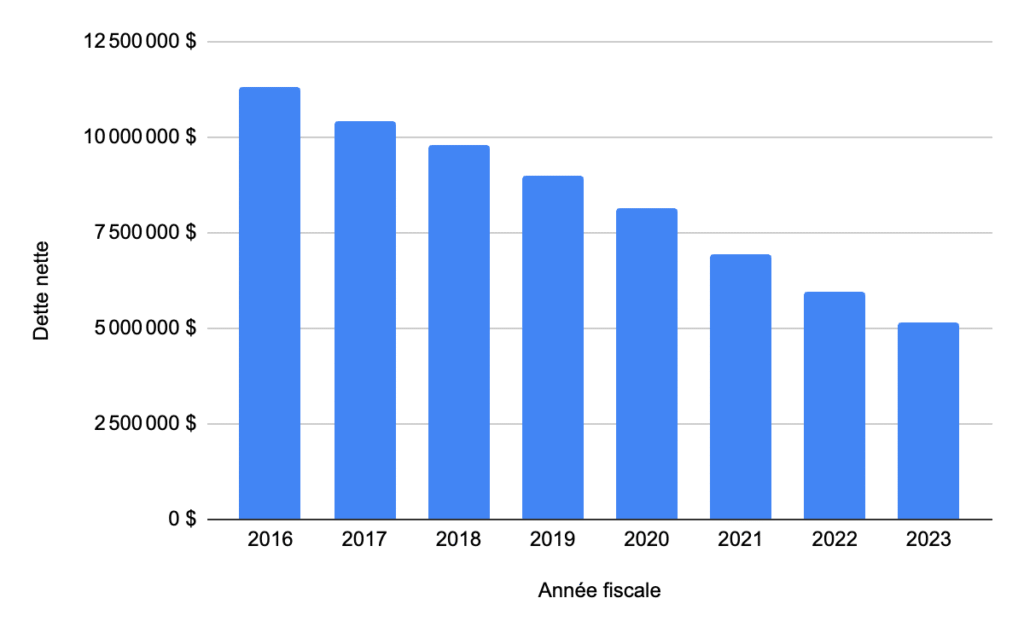
Net debt since 2016
Net debt is currently $5,133,550 at the end of 2023.
Graph showing the evolution of net debt since 2016
Graph showing the change in net debt by adding financial assets and financial liabilities since 2016

| Fiscal year | Financial assets | Financial liabilities | Net debt |
| 2016 | 7 270 465 $ | 18 590 904 $ | -11 320 439 $ |
| 2017 | 6 482 434 $ | 16 915 684 $ | -10 433 250 $ |
| 2018 | 6 220 611 $ | 16 021 863 $ | -9 801 252 $ |
| 2019 | 5 318 351 $ | 14 312 227 $ | -8 993 876 $ |
| 2020 | 4 998 781 $ | 13 147 077 $ | -8 148 296 $ |
| 2021 | 5 188 186 $ | 12 144 277 $ | -6 956 091 $ |
| 2022 | 4 993 363 $ | 10 972 151 $ | -5 978 788 $ |
| 2023 | 5 125 769 $ | 10 259 319 $ | -5 133 550 $ |
Long-term debt since 2016
The municipality’s current long-term debt is $9,068,055 at the end of 2023.
Graph showing the evolution of long-term debt since 2016
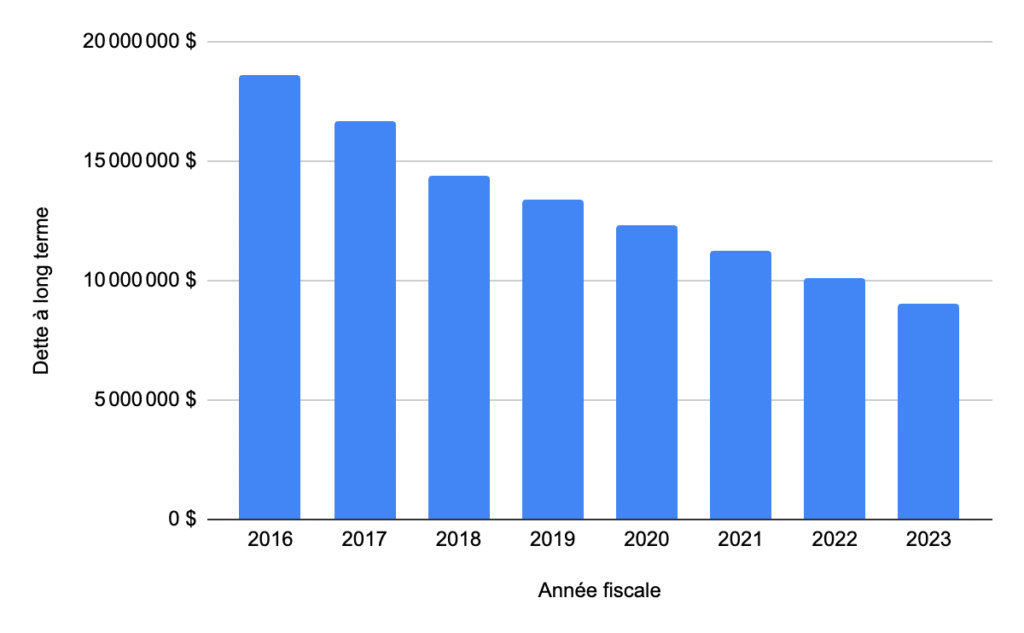
| Fiscal year | Long-term debt |
| 2016 | 18 590 904 $ |
| 2017 | 16 656 200 $ |
| 2018 | 14 425 790 $ |
| 2019 | 13 387 725 $ |
| 2020 | 12 324 438 $ |
| 2021 | 11 228 734 $ |
| 2022 | 10 121 148 $ |
| 2023 | 9 068 055 $ |
Mortgages and loans
Currently, long-term debt is repayable at rates ranging from 1.5% to 5.5%. All loans are renewable between 2024 and 2028. It is therefore essential to know the details of these loans, the renewal dates, and the new interest rates. As you know, interest rates are much higher at present, which could lead to a significant increase in the municipality’s annual interest payments.
Graph showing the evolution of remaining long-term debt from 2016 to today, repayments, and the budget surplus.

| Fiscal year | Municipal debt | Debt repayment | Budget surplus (deficit) |
| 2016 | 8 728 905 $ | ||
| 2017 | 8 056 880 $ | 672 025 $ | 212 007 $ |
| 2018 | 7 654 149 $ | 402 731 $ | 249 532 $ |
| 2019 | 6 909 760 $ | 744 389 $ | -278 679 $ |
| 2020 | 6 235 162 $ | 674 598 $ | 42 162 $ |
| 2021 | 5 494 778 $ | 740 384 $ | 280 331 $ |
| 2022 | 4 726 395 $ | 768 383 $ | 167 740 $ |
| 2023 | 4 043 170 $ | 683 225 $ | 40 505 $ |
| 2024 | 3 981 833 $ | 61 337 $ | 202 267 $ |
| 2025 | 4 043 170 $ | unknown | unknown |
Budget surplus (deficit) since 2016
This amount corresponds to the difference between income and expenditure over the years. We refer to an accumulated surplus when income exceeds expenditure and an accumulated deficit when expenditure exceeds income.
Graph showing budget surpluses (deficits) in dollars since 2016
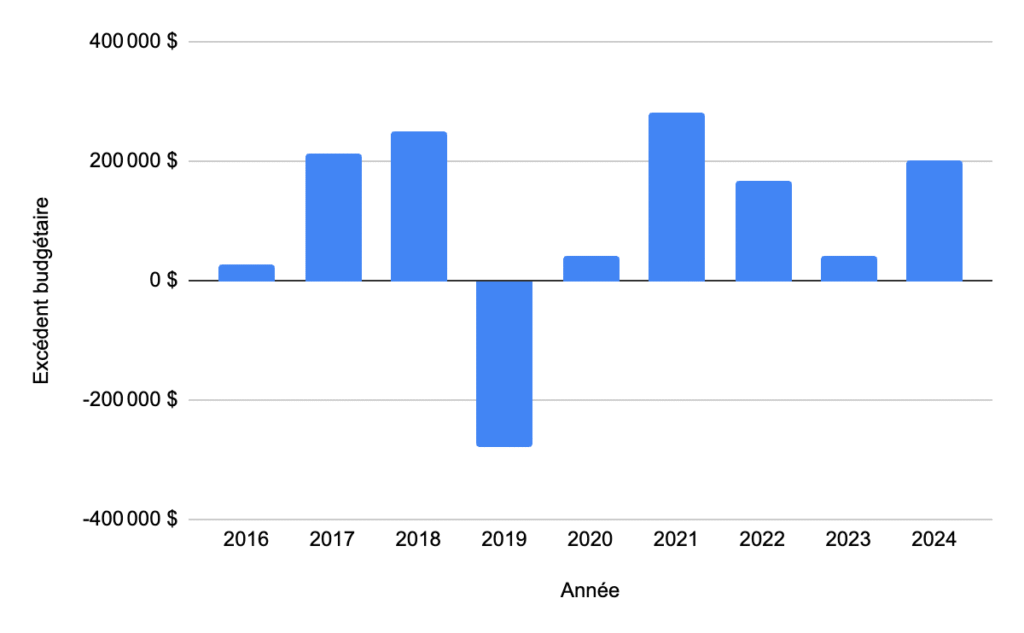
| Fiscal year | Budget surplus (deficit) |
| 2016 | 26 716 $ |
| 2017 | 212 007 $ |
| 2018 | 249 532 $ |
| 2019 | -278 679 $ |
| 2020 | 42 162 $ |
| 2021 | 280 331 $ |
| 2022 | 167 740 $ |
| 2023 | 40 505 $ |
| 2024 | 202 267 $ |
Repayment of municipal debt and budget surpluses since 2016
- During 2023, the municipality recorded a debt repayment of $61,337, the lowest since 2016.
- In 2023, the municipality recorded a budget surplus of $40,505.
Graph: Municipal debt repayment amounts and budget surpluses from 2016 to 2024.

| Fiscal year | Debt repayment | Budget surplus (deficit) |
| 2016 | ||
| 2017 | 672 025 $ | 212 007 $ |
| 2018 | 402 731 $ | 249 532 $ |
| 2019 | 744 389 $ | -278 679 $ |
| 2020 | 674 598 $ | 42 162 $ |
| 2021 | 740 384 $ | 280 331 $ |
| 2022 | 768 383 $ | 167 740 $ |
| 2023 | 683 225 $ | 40 505 $ |
| 2024 | 61 337 $ | 202 267 $ |
Municipal debt since 2016
- The municipality repays an average of $593,384 per year on its debt.
- The municipality aims to repay $985,873 during 2025 (budget).
- The amount for 2024 is $61,337, the lowest debt repayment amount recorded since 2016.
Graph: Change in municipal debt and repayment amounts from 2016 to 2025.

| Fiscal year | Municipal debt |
| 2016 | 8 728 905 $ |
| 2017 | 8 056 880 $ |
| 2018 | 7 654 149 $ |
| 2019 | 6 909 760 $ |
| 2020 | 6 235 162 $ |
| 2021 | 5 494 778 $ |
| 2022 | 4 726 395 $ |
| 2023 | 4 043 170 $ |
| 2024 | 3 981 833$ |
Graph: Change in the municipality’s long-term debt since 2016

| Fiscal year | Municipal debt | Financial liabilities | Long-term debt |
| 2016 | 8 728 905 $ | 18 590 904 $ | 16 656 200$ |
| 2017 | 8 056 880 $ | 16 915 684 $ | 15 515 487$ |
| 2018 | 7 654 149 $ | 16 021 863 $ | 14 425 790 $ |
| 2019 | 6 909 760 $ | 14 307 616 $ | 13 387 725 $ |
| 2020 | 6 235 162 $ | 13 147 077 $ | 12 324 438 $ |
| 2021 | 5 494 778 $ | 12 144 277 $ | 11 228 734 $ |
| 2022 | 4 726 395 $ | 10 972 121 $ | 10 121 148 $ |
| 2023 | 4 043 170 $ | 10 259 319 $ | 9 068 055 $ |
| 2024 | 3 981 833 $ | inconnu | inconnu |
Total employee compensation since 2016
- The payroll for municipal employees rose from $356,521 in 2016 to $837,966 in 2023 before payroll taxes.
- It should be noted that actual payroll expenses for 2024 and 2025 are not available.
Graph showing municipal employee compensation before social security contributions from 2016 to 2023

| Fiscal year | Total employee compensation before payroll taxes |
| 2016 | 356 521 $ |
| 2017 | 436 159 $ |
| 2018 | 451 111 $ |
| 2019 | 537 642 $ |
| 2020 | 507 819 $ |
| 2021 | 598 983 $ |
| 2022 | 576 719 $ |
| 2023 | 837 966 $ |
Number of full-time employees since 2016
- Since 2016, the number of full-time employees has increased from 7 to 11.3.
- It should be noted that the actual number of full-time employees for 2024 and 2025 is not available.
Graph showing the number of full-time municipal employees from 2016 to 2023

| Fiscal year | Full-time employees |
| 2016 | 7 |
| 2017 | 7,5 |
| 2018 | 9,4 |
| 2019 | 7 |
| 2020 | 7 |
| 2021 | 7 |
| 2022 | 9,3 |
| 2023 | 11,3 |
Total compensation for municipal employees since 2016
- In 2023, the municipality of North Hatley has 11.3 full-time employees.
- In 2023, municipal employee compensation totaled $837,966, for a total of $1,004,331 including payroll expenses.
- It should be noted that actual payroll expenses for 2024 and 2025 are not available.
Here is the 2023 salary table for the municipality of North Hatley, available here.
| Employee compensation in 2023 | ||||||||
| Workforce | Normal week | Standard hours | Pay | Social security contributions | Total pay | Average pay before Social security contributions | Average pay after Social security contributions | |
| Cadres et contremaîtres | 3,3 | 35 | 6546 | 287 969 $ | 68 969 $ | 356 938 $ | 87 263,33$ | 108 163,03$ |
| Professionnels | ||||||||
| Cols blancs | 5 | 35 | 8691 | 229 893$ | 50 648$ | 280 541$ | 45 978,60$ | 56 108,20$ |
| Cols bleus | 3 | 40 | 6944 | 320104$ | 46 748$ | 366 852$ | 106 701,33$ | 122 284,00$ |
| Total | 11,3 | 22 181 | 837 966 $ | 1 004 331 $ | ||||
Municipal employee compensation since 2016
- In 2023, the municipality has 11.3 full-time employees and total compensation before payroll taxes is $837,966 and $1,004,331 with payroll taxes.
- In 2023, the municipality has 3.3 full-time managers and supervisors, whose average compensation is $87,263 before payroll taxes.
- In 2023, the municipality has 5 white-collar workers, whose average compensation is $45,979 before payroll taxes.
- In 2023, the municipality has 3 blue-collar workers with an average salary of $106,701 before payroll taxes.
Chart showing total compensation for municipal employees before social security contributions from 2016 to 2023

| Fiscal year | Total pay | Number of full-time employees |
| 2016 | 356 521 $ | 7 |
| 2017 | 436 159 $ | 7,5 |
| 2018 | 451 111 $ | 9,4 |
| 2019 | 537 642 $ | 7 |
| 2020 | 507 819 $ | 7 |
| 2021 | 598 983 $ | 7 |
| 2022 | 576 719 $ | 9,3 |
| 2023 | 837 966 $ | 11,3 |
| Managers and supervisors | |||
| Fiscal year | Number of full-time employees | Total pay before Social security contributions | Average pay per employe before Social security contributions |
| 2016 | 3,3 | 209 467$ | 63 475 $ |
| 2017 | 2 | 184 758$ | 92 379 $ |
| 2018 | 1,9 | 142 584$ | 75 044 $ |
| 2019 | 3,3 | 182 061$ | 55 170 $ |
| 2020 | 3,3 | 283 028 | 85 766 $ |
| 2021 | 3,3 | 272 625$ | 82 614 $ |
| 2022 | 3,3 | 287 224$ | 87 038 $ |
| 2023 | 3,3 | 287 969$ | 87 263 $ |
| White collars | |||
| Fiscal year | Number of full-time employees | Total pay before Social security contributions | Average pay per employe before Social security contributions |
| 2016 | 2,2 | 89 240 $ | 40 564 $ |
| 2017 | 2,5 | 97 922 $ | 39 169 $ |
| 2018 | 3,9 | 74 370 $ | 19 069 $ |
| 2019 | 2,2 | 97 897 $ | 44 499 $ |
| 2020 | 2,2 | 74 370 $ | 33 805 $ |
| 2021 | 4 | 178 170 $ | 44 543 $ |
| 2022 | 4 | 176 852 $ | 44 213 $ |
| 2023 | 5 | 229 893 $ | 45 979 $ |
| Blue collars | |||
| Fiscal year | Number of full-time employees | Total pay before Social security contributions | Average pay per employe before Social security contributions |
| 2016 | 1,5 | 57 814 $ | 38 543 $ |
| 2017 | 3 | 153 479 $ | 51 160 $ |
| 2018 | 3,6 | 222 657 $ | 61 849 $ |
| 2019 | 1,5 | 257 684 $ | 171 789 $ |
| 2020 | 1,5 | 150 421 $ | 100 281 $ |
| 2021 | 1,5 | 148 188 $ | 98 792 $ |
| 2022 | 2 | 112 643 $ | 56 322 $ |
| 2023 | 3 | 320 104 $ | 106 701 $ |
It would be useful to know the average salary in 2025 as reported by the municipal administration. In fact, several citizens have told me that they have submitted freedom of information requests to obtain this data. Their requests have so far gone unanswered.
Average remuneration of elected officials since 2016
- Since 2016, elected officials’ compensation has risen from $34,522 in 2016 to $105,796 in 2023 before social security contributions.
- It should be noted that actual expenditure on elected officials’ salaries for 2024 and 2025 is not available.
Graph showing the average remuneration of municipal elected officials from 2016 to 2023

| Fiscal year | Total pay | Number of elected officials | Social security contributions | Total pay with social security contributions | Social security contributions | Difference from the previous year |
| 2016 | 34 522 $ | 7 | 1528$ | 36 057$ | 4 931$ | |
| 2017 | 32 390 $ | 6,2 | 1703$ | 34 099$ | 5 224$ | 5,93% |
| 2018 | 33 169 $ | 7 | 1184$ | 34 360$ | 4 738$ | -9,30% |
| 2019 | 52 680 $ | 8 | 2287$ | 54 975$ | 6 585$ | 38,97% |
| 2020 | 61 447 $ | 7 | 7765$ | 69 219$ | 8 778$ | 33,31% |
| 2021 | 78 785 $ | 7 | 5 610$ | 84 402$ | 11 255$ | 28,22% |
| 2022 | 85 470 $ | 7 | 8 149$ | 93 6260$ | 12 210$ | 8,49% |
| 2023 | 105 796 $ | 7 | 6 883$ | 112 686$ | 15 113$ | 23,78% |
Conclusion
- The municipality’s 2024 financial reports are not available at the Ministry.
- The detailed expenditure budget for 2025 is also missing.
- Administrative costs represent 26.12% of the municipality’s total expenditures. Details of these administrative costs would be helpful in better understanding the distribution of these expenses. At this time, I have not found any information on this subject. What are the administrative costs for 2024 and 2025? I have not found anything.
- According to the most recent financial data available, the municipality operates with 11.3 employees (in 2023) and has total salary expenses of over $1 million, in addition to six elected officials and a mayor with total compensation of $112,679, which is nearly three times higher than in 2016. How many full-time employees will the municipality hire in 2024 and 2025? I couldn’t find anything.
- The long-term debt of the village of North Hatley is $10,259,319 at the end of 2023.
- The municipality’s net debt is $5,133,550 at the end of 2023.
- During 2023, the municipality recorded a debt repayment of $61,337, the lowest since 2016.
- Since 2016, the municipal administration has been repaying an average of $593,384 per year.
- Several key financial details are not available for 2024 and 2025.
With that said, I have given my all to provide you with an overview of North Hatley’s financial situation to the best of my knowledge. I have reached the limits of my expertise. Your help is welcome!
It would be very useful, if not necessary, to simplify and break down public finance reports with the help of experts to make them easier for the public to understand each year.
The municipality will give a presentation tomorrow, September 16, at 7:00 p.m. at Saint-Élizabeth Church to shed some light on the matter.
Référence : https://www.mamh.gouv.qc.ca/documentsfinanciersweb/Rapport-financier-2023-et-autres-45050.pdf
Understanding administrative fees (according to ChatGPT)
Administrative expenses correspond to expenditures related to the day-to-day management and general administration of the municipality. This budget item includes several types of costs that are necessary for the proper functioning of the municipal apparatus but are not directly related to services offered to citizens, such as roads, recreation, or public safety.
Administrative expenses reflect the cost of municipal governance and internal management, even if they are not always visible to citizens. They are essential to ensuring the rigorous, transparent, and efficient management of public funds and services.
Salaries and benefits for administrative staff
- Executive Management
- Secretariat
- Human Resources
- Finance and Accounting
- Legal Services
- Communications
Municipal office operating costs
- Office supplies
- Telecommunications services (telephone, internet)
- Management software
- Maintenance of administrative buildings
- Insurance
Professional services
- Fees for external accountants or auditors
- Legal advisors
- Management or information technology consultants
Overhead costs
- Membership fees for municipal associations (e.g., FQM, UMQ)
- Staff training
- Expenses related to municipal council meetings
- Institutional advertising or internal communications
Financial management
- Membership fees for municipal associations (e.g., FQM, UMQ)
- Staff training
- Expenses related to municipal council meetings
- Institutional advertising or internal communications
_____________________________________________________________________________________


Excellent analysis Philippe. With so little information available from town hall, this really helps makes sense of the serious issues North Hatley is facing. The hike in expenses and the fact North Hatley is no longer paying down debt (only $60,000 paid off in 2023) are big red flags.
I don’t believe the municipality aims to repay $985,873 during 2025 (budget). I believe this $985,873 figure includes interest expenses on the town’s existing $10,000,000 long & short term debt. At 4% interest, the carying cost alone for this debt would be $400,000.